
A company’s financial statements are comprised of 3 primary documents: Income Statement, Balance Sheet, and Cash Flow Statement. Each one is critically important to review and understand before buying a stock.
The good news? The information is public. You can find a company’s financial statements on its Investor Relations website. They’re also available on Yahoo Finance, Fidelity, TD Ameritrade and Quickfs.
After finding a buy candidate using a stock screener (one of my favorites here), my first line of business is to analyze the Income Statement. But my second priority is the Balance Sheet.
In this article, I’ll review a common sense approach to analyzing the Balance Sheet to determine if the stock warrants additional attention. If it passes the test, it’s then time to dig even deeper.
What is a Balance Sheet?
If you’re new to investing (or even if you’re not), you may be wondering what a Balance Sheet is. Investopedia defines a Balance Sheet as “a financial statement that reports a company’s assets, liabilities, and shareholder equity at a specific point in time.”
This is all well and good, but it doesn’t mean a whole lot to the average-Joe investor. The first time I looked at a Balance Sheet I hadn’t the slightest clue what I was seeing. This definition doesn’t help matters. Like I mentioned, analyzing the Balance Sheet should be so simple anyone can do it.
It’s helpful to think about a Balance Sheet as would your personal finances. Imagine listing all your assets (cash, retirement savings, vehicles, home, etc…) on a sheet of paper along with all your liabilities (car payment, mortgage, interest on loans, etc…). Plus any equity you may have in your home (home value minus remaining mortgage).
This is essentially what a Balance Sheet represents for a company at a specific point in time.
Key components of the Balance Sheet
There are parts of the Balance Sheet I spend more time on than others. And some parts I ignore altogether. Remember – this is intended to be a quick review to determine if a stock warrants additional attention. Here are the items I find most important.
Current Assets
Current Assets represent a company’s assets which could be turned into liquid cash within a year. For example, if you own a boat, it may be classified as a Current Asset because you could likely sell it within a year.
On a Balance Sheet, some of the items you’ll see listed under Current Assets are:
- Cash and cash equivalents
- Marketable securities
- Short-term investments
- Inventory
- Accounts receivable
My favorite Current Asset is cash. As the saying goes, cash is king.
Current Liabilities
Current Liabilities represent a company’s liabilities which are coming due within a year. Back to our boat example. If you’re paying on a loan for the boat, a current liability would be the amount coming due in the next 12 months.
On a Balance Sheet, some of the items you’ll see listed under Current Liabilities are:
- Accounts payable
- Tax payable
- Short-term debt
- Deferred revenue
- Accrued liabilities
I pay the most attention to short-term debt.
Long-Term Debt
Long-term debt is exactly as it sounds. It’s debt that’s coming due beyond the next 12 months. Think of it as the amount remaining on your mortgage less the next 12 month’s payments.
Long-term debt is listed under Non-Current Liabilities on the Balance Sheet.
Goodwill
Companies acquire other companies all the time. When a company purchases another company at a price greater than its book value, the difference is listed as goodwill under Non-Current Assets.
Let’s say you’re looking to buy a house valued at $300,000. But you’re not the only buyer interested. You get into a bidding war which drives your offer to $350,000. You love the house so you’re willing to pay above its value. The offer is accepted and you purchase at $350,000. The $50,000 above value would be listed as goodwill on the Balance Sheet.
Retained Earnings (or Accumulated Deficit)
Retained Earnings represent the cumulative earnings (net income) a company has retained and not paid out as dividends. If a company is unprofitable and losing money, Retained Earnings is replaced with Accumulated Deficit on the Balance Sheet. Accumulated Deficit shows the cumulative losses attributable to the company.
Treasury Stock
Treasury Stock represents stock which has been repurchased and retired by the company. It isn’t available for repurchase nor included in the number of shares outstanding. Treasury Stock is a good thing to see on the Balance Sheet.
Shareholder’s Equity
Shareholder’s Equity is calculated by subtracting Total Liabilities from Total Assets. It’s a gauge of how much would be paid to shareholders if the company were to be liquidated. Shareholder’s Equity is also known as book value.
Analyzing the Balance Sheet
Now that we’ve laid a solid foundation, let’s take a look at a real-life example using Nike (NKE). This is my step-by-step approach for analyzing the Balance Sheet.
Note – when analyzing the Balance Sheet, you should look at the most recent period because it reflects current data regardless of quarter or year. This is dissimilar to the Income Statement and Cash Flow Statement which reflect quarterly and/or yearly performance.
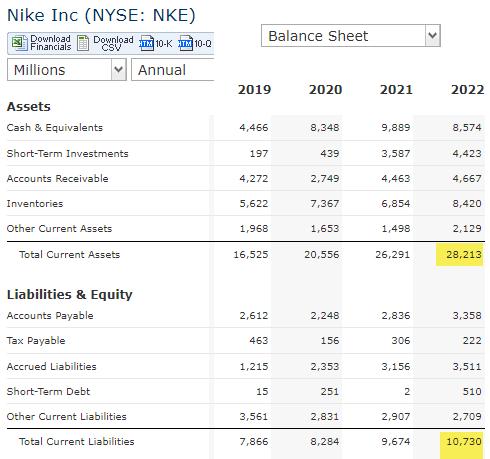
Step #1: Calculate working capital
Working capital isn’t listed on the Balance Sheet, but you can calculate it by subtracting Current Liabilities from Current Assets. Working capital is a quick measure to determine if the company has enough money to pay its bills over the coming 12 months.
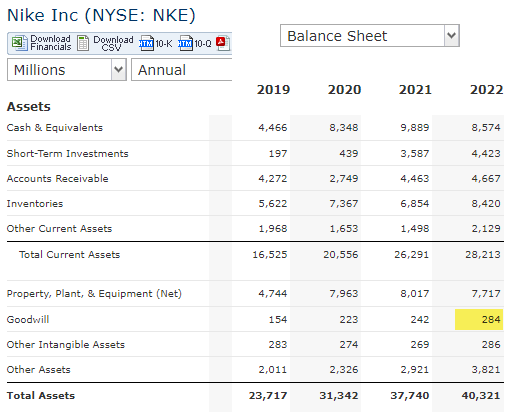
In this example, NKE lists $28.2 billion in Current Assets and $10.7 billion in Current Liabilities for total working capital of $17.5 billion. This gives me confidence NKE can meet its financial obligations over the coming year.
Some industries operate in a negative working capital environment, namely restaurants. This is because customers pay upfront, allowing restaurants to pay off Accounts Payable quickly and reduce Current Assets on the Balance Sheet.
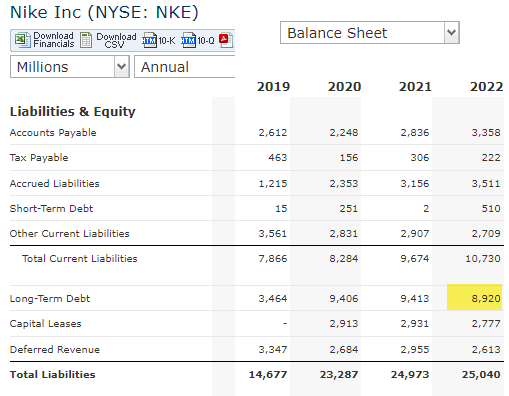
Step #2: Analyze long-term debt
Debt is often thought of as bad, but it’s essential in helping companies grow. As with most everything, it’s good in moderation. What’s important is determining whether the company has enough cash or produces enough cash flow to timely service its debt.
I prefer to analyze the Balance Sheet in conjunction with the Cash Flow Statement (and Income Statement for that matter). I learned this from Warren Buffett (check out this book). Warren prefers companies with enough cash flow to pay off long-term debt within 3 or 4 years.
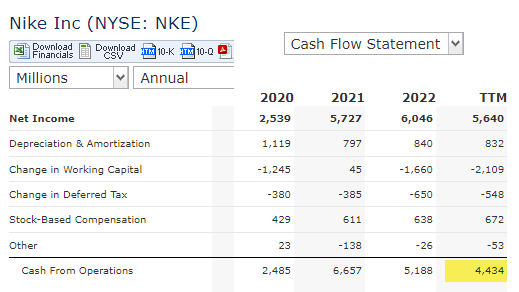
In our example, NKE lists $8.9 billion in long-term debt. This may seem like a lot, but it’s not enough information to say for certain. We also need to review the Cash Flow Statement.
The Cash Flow Statement reveals NKE generated $4.4 billion in cash flow for the trailing twelve month (TTM) period. So, it would only take 2 years for NKE to pay off all its long-term debt using cash flow from operations. NKE doesn’t appear to be too heavily indebted.
Also, if you take a closer look at NKE’s Balance Sheet, they have enough cash to cover nearly 100% of the long-term debt. I’m not concerned about NKE going bankrupt any time soon.
Step #3: How much Goodwill is on the Balance Sheet?
Goodwill on the Balance Sheet isn’t necessarily a bad thing. I like to compare it to cash on hand. If the company has more goodwill than cash, that’s a red flag. You’ll likely see a lot of long-term debt as well.
Company’s amortize (write-off) goodwill. Meaning they gradually reduce the amount of goodwill on the Balance Sheet by incurring a non-cash expense on the Income Statement. This has a direct impact on net income and reduces earnings per share (EPS).
NKE only has $284 million of goodwill compared to $8.6 billion in cash, so I’m not worried.
Goodwill may also be an indicator of how well management deploys funds. Are they prudent with their dollars, paying only fair value? Or do they splurge to acquire companies at any cost? If they splurge on acquisitions, what else might they splurge on?
Step #4: Retained Earnings or Accumulated Deficit?
Retained Earnings (RE), or lack thereof, is an easy way to tell if a company is making money. But there are a few things to consider:
- If not paying dividends, it’s generally good for RE to be increasing each quarter. This is if return on RE (RORE) is >10%. If RORE is <10%, it’s an indication the company may be better off paying dividends to shareholders.
- If RE is negative or decreasing each quarter, it’s an indication the company is paying out all earnings as dividends. This is good for shareholders.
- If Accumulated Deficit is increasing each quarter, it’s an indication the company has turned profitable and may soon be reporting positive RE on the Balance Sheet.
Notice how NKE’s RE decreased from 2018 through 2020, even going negative? This tells me NKE paid out a lot in dividends.
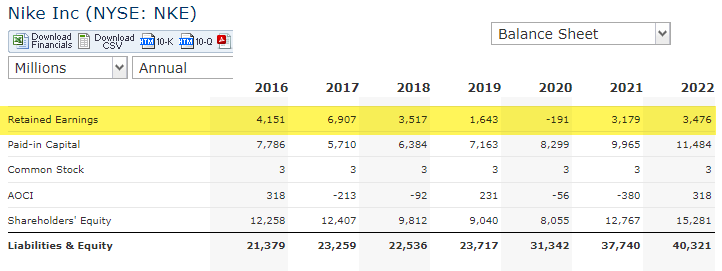
Then Covid hit in 2021 where NKE benefited from government stimulus. And generated its highest free cash flow in 10 years while maintaining its dividend. This explains why RE turned positive in 2021. The company is retaining more earnings than its paying out.
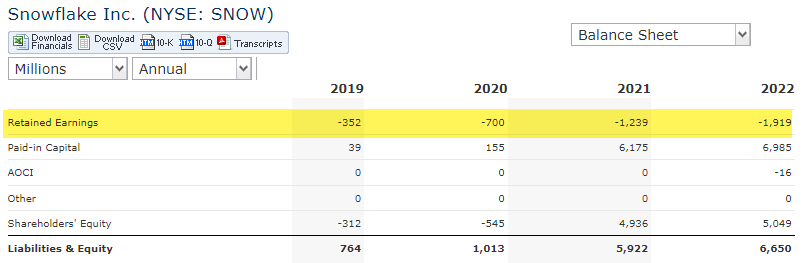
On the opposite end, let’s take a look at Snowflake (SNOW). Notice how RE (or Accumulated Deficit) gets more negative each year? This is because SNOW isn’t GAAP profitable, and is losing money each year.
Step #5: Treasury stock and share repurchases
Treasury stock shows up on the Balance Sheet if a company is repurchasing its own stock. Share repurchases are a benefit to shareholders because it reduces the total number of shares outstanding. In turn, this increases per share items such as EPS and FCF.
But not all companies who repurchase shares list Treasury Stock on the Balance Sheet. NKE is such a company. Treasury Stock would be listed in the same section as RE and Shareholder’s Equity, but NKE lists nothing.
The good news is there are other ways to determine if a company is repurchasing shares:
- The company announces and/or reports out on a share repurchase program via press release. Check out the Investor Relations website.
- Total shares outstanding is steadily decreasing each year on the Income Statement.
- Net issuance of common stock is negative each year on the Cash Flow Statement (i.e. the company is repurchasing more stock than its offering).
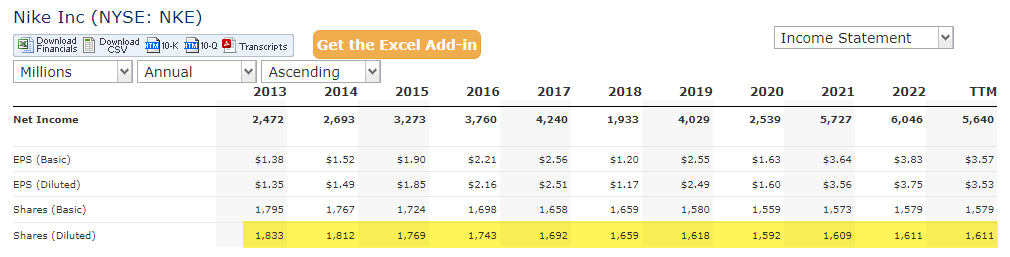
On NKE’s Income Statement above, diluted shares outstanding is decreasing ever so slightly each year. This is an indication NKE is repurchasing shares which is good for shareholders.
Step #6: Review Steps 1-5 from a multi-year view
The last step is something we’ve done a little bit of already. And that’s to analyze the Balance Sheet over time. I encourage you to analyze the Balance Sheet from a multi-year view.
A few questions to ask yourself:
- Is the cash balance growing each year?
- Any red flags on Inventory?
- Is long-term debt accumulating?
- Notice a big swing in working capital?
Abnormalities will stand out like a sore thumb when analyzing the Balance Sheet from a long-term perspective.
Bottom Line
This 6 step approach to analyzing the Balance Sheet is a good foundation to get you started. But be sure to add your own flavor, and tweak it to make it your own.
Truthfully, there’s no wrong way to analyze the Balance Sheet. Just take time to do it. And be sure to analyze it in conjunction with the Income Statement and Cash Flow Statement.
When it comes to investing, I like to keep it simple. With a little practice, you’ll soon be analyzing Balance Sheets like a pro. And building conviction in your next stock pick.


